
This Australian Charities Report is the annual analysis of the information we receive from charities in their Annual Information Statements. This is the 12th edition.
Foreword

In this 12th edition of the Australian Charities Report, I am proud to share our latest annual comprehensive analysis of sector data. We present findings based on information from 53,641 Annual Information Statements submitted by charities for the 2024 reporting period.

Detailed charity size analysis offers a more nuanced understanding about the state of Australia’s diverse charity sector, so we have separately analysed size variations (Section 2).
This report matters because high-quality data boosts transparency, and bolsters confidence in the sector.
It helps donors and funders make informed decisions, supports governments to develop sound policy and gives charities a clearer picture of their operating environment. Further, it supports our work to streamline reporting requirements and cut red tape, so charities can spend more time focusing on their essential work.
Rise in employees and volunteer count
Total sector employment grew, with charities employing 1.6 million staff, or 11% of Australia’s workforce, when compared with 2025 Australian Bureau of Statistics (ABS) workforce data.
That’s a rise from 10.7% previously. Major service organisations – such as schools, health services and care providers – were significant employers nationally.
Registered charities reported that they engaged 3.9 million volunteers – the highest registered charity volunteer count ever reported to the ACNC.
There were 2.5 volunteers for every employee. It is remarkable that more than half of all charities, 53%, operated with no paid staff, relying entirely on the dedication of their volunteers.
Remarkable too that we have seen this reliance on volunteers – by around half of all charities – in almost every edition of the Australian Charities Report since we published the first report in 2014.
Expenses outpace significant revenue growth
Financial insights in this edition help explain the scale, achievements and challenges faced by Australian charities. Cost of living pressures, both for charities and the communities they serve, show up again in this report.
Charities generated $239 billion in revenue, a significant 7.5% increase that surpassed growth in the wider economy. However, total sector expenses rose by 8.6%, to $231 billion, outpacing this revenue growth.
The larger total expenses bill reflects a combination of factors that many charities have highlighted to us in various forums. More people turned to charities for support as they struggled with cost of living pressures so, where they could, charities employed more staff to meet the demand. Yet basic operating costs for charities rose, including wages, insurance and utilities. That’s a difficult combination for many charities.
Donations and bequests reached $14.8 billion. This is a strong result – it’s the second-highest total ever, even though it is a decline compared to $18.9 billion in the 2023 reporting period (which was higher only because of a record $4.9 billion donation to one single charity).
Government funding was the largest revenue source at $118 billion, while revenue from goods and services was $83 billion.
Differences across the sector
Our latest analysis confirms that smaller charities operate with significantly fewer financial resources – not only in revenue, but also in the share of donations and bequests they attract and the assets they hold.
Extra large charities (annual revenue of $100 million or more) made up just 0.6% of the sector. Yet they generated 57% of total sector revenue, received around 21% of donations and bequests, and held roughly half of all sector assets.
By comparison, 60% of all charities were small or extra small (less than $500,000 in annual revenue). Together, they generated just 1.4% of total sector revenue, received only 8.6% of all donations and bequests, and held less than 5% of sector assets – highlighting the lesser financial capacity these charities have across the key measures.
More charities report servicing people aged 65 or over
In the 2024 reporting period, there was a change among the top beneficiary groups. ‘Adults – aged 65 or over’ entered the top three, as the third most common beneficiary group, with 6.9% of charities reporting them as a program beneficiary. This is 0.3% higher than it was five years ago, in the 2020 reporting period. However, this slight shift is important to be aware of, as it aligns with ABS data on Australia’s ageing population.
The top two most common beneficiary groups were the same as in the previous year: ‘Adults – aged 25 to under 65’ at 8.1%, and ‘Youth – aged 15 to under 25’ at 7.8%. ‘Families’ fell out of the top three to occupy fourth place.
In conclusion, I hope you find the insights in this 12th edition useful, and I invite you to further interrogate the dataset. The Charity Data Explorer allows you to tailor your search based on location, size and other attributes that may be of particular interest. This report and all previous editions are available in the Charity Data Hub.
One of our primary goals is to maintain, protect and enhance confidence in the sector, and transparency is fundamental in achieving that. By publishing detailed statistics and analysis, we build a rich bank of data that reveals much about a sector over time, and because of that, is important to the nation. Our data shows yet again that the sector is a major economic force; a contribution in addition to the sector’s indispensable social role as the connective tissue for communities across Australia and abroad.
Join with me in using this edition of the Australian Charities Report as a foundation for conversations about how we can nurture and sustain this vital sector.
Warm regards,
Sue Woodward AM
Commissioner
Australian Charities and Not-for-profits Commission
This is the 12th edition of the Australian Charities Report. The report draws on data from 53,641 Annual Information Statements submitted by charities for the 2024 reporting period.
The two most common reporting periods used by charities when preparing their 2024 Annual Information Statements were the financial year (1 July 2023 to 30 June 2024) or the calendar year (1 January 2024 to 31 December 2024).
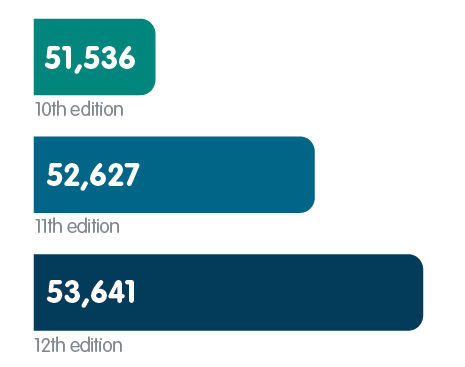
11th edition: 52,627
12th edition: 53,641
In comparison to the previous Australian Charities Report, this edition incorporates data drawn from an additional 1,014 Annual Information Statements, the most ever analysed. This reflects the growth in charity numbers during the period.
However, the number of 2024 Annual Information Statements drawn on for this edition of the Australian Charities Report does not match the total number of charities registered with the ACNC (62,867 charities as at 1 January 2025) because:
- charities regulated by the Office of the Registrar of Indigenous Corporations (ORIC) only submit their reporting to ORIC each year as part of streamlined reporting arrangements
- many newly registered charities were not due to report – while all charities must submit an Annual Information Statement each reporting period, newly registered charities may not have reached their first reporting deadline (typically 18 months after they are registered)
- some charities submit a single Annual Information Statement on behalf of an ACNC approved reporting group
- some charities were late submitting their 2024 Annual Information Statement.
Refer to the Data section for more information about our data and analysis.
This edition of the Australian Charities Report has two main sections:
- an overall analysis of data at a broad charity sector level
- a more detailed analysis of data focused on charity size.
The ACNC’s Charity Data Explorer
Our interactive Charity Data Explorer allows the public to conduct searches using 2024 Annual Information Statement data.
You can use the Charity Data Explorer to filter data by:
- the six charity sizes used in this report
- the state or territory in which a charity’s physical address is located
- urban/regional
- postcode
- charity subtype.
You can also use the Charity Data Explorer to:
- find averages of financial information
- filter by overseas programs/activities
- see how charity subtypes have changed over time.
Overview of key financial terms used in this report
Revenue = Income received by a charity when undertaking ordinary activities (for example, donations and bequests).
Other income = Income (or loss) from transactions that, while not part of a charity’s ordinary activities, affect the charity’s bottom line. For example, ‘other income’ can include a realised gain or loss on the sale of a building.
Total income = total revenue + other income
Expenses = Costs incurred by a charity (for example, rent or employee expenses).
Net income = total income – total expenses
Assets = Resources controlled by a charity such as cash, shares, property, equipment and trademarks.
Liabilities = Includes amounts owed to suppliers or creditors, loans and employee entitlements.
Net assets = total assets – total liabilities
Understanding charities' financial information
Although the key terms listed can provide a good starting point for understanding the charity sector and its diversity, there is so much variety in the sector that it can be difficult – and potentially misleading – to compare or evaluate charities based on their revenue and expenses alone.
The asset ratio can help provide more information about a charity’s financial sustainability.
Asset ratio = total assets / total liabilities
A ratio of more than one indicates that a charity’s assets exceed its liabilities. A higher asset ratio might indicate that a charity has set aside funds – known as reserves – to help ensure its financial stability and sustainability.
It should also be noted that charities may hold funds for ‘specific purposes’ – these are restricted funds and cannot be used to satisfy other general debts.
Section 1: Australia's registered charities
Snapshot
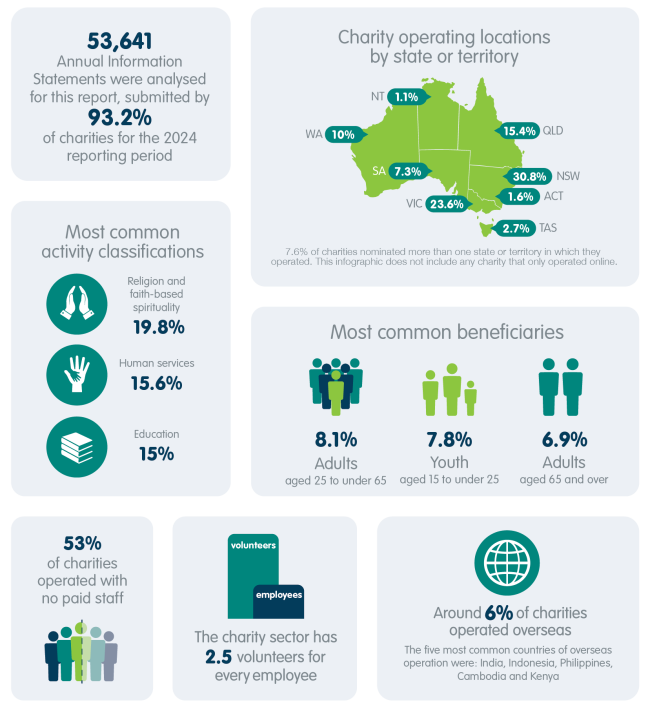
- 53,641 Annual Information Statements were analysed for this report, submitted by 93.2% of charities for the 2024 reporting period
Charity operating locations
By state or territory:
- ACT: 1.6%
- NSW: 30.8%
- NT: 1.1%
- QLD: 15.4%
- SA: 7.3%
- TAS: 2.7%
- VIC: 23.6%
- WA: 10%
- 7.6% of charities nominated more than one state or territory in which they operated. This does not include any charity that only operated online.
Overseas:
- Around 6% of charities operated overseas
- The five most common countries of overseas operation were:
- India
- Indonesia
- Philippines
- Cambodia
- Kenya
Most common activity classifications
- Religion and faith-based spirituality: 19.8%
- Human services: 15.6%
- Education: 15%
Most common beneficiaries
- Adults (aged 25 to under 65): 8.1%
- Youth (aged 15 to under 25): 7.8%
- Adults (aged 65 and over): 6.9%
Employees and volunteers
- 53% of charities operated with no paid staff
- The charity sector has 2.5 volunteers for every employee
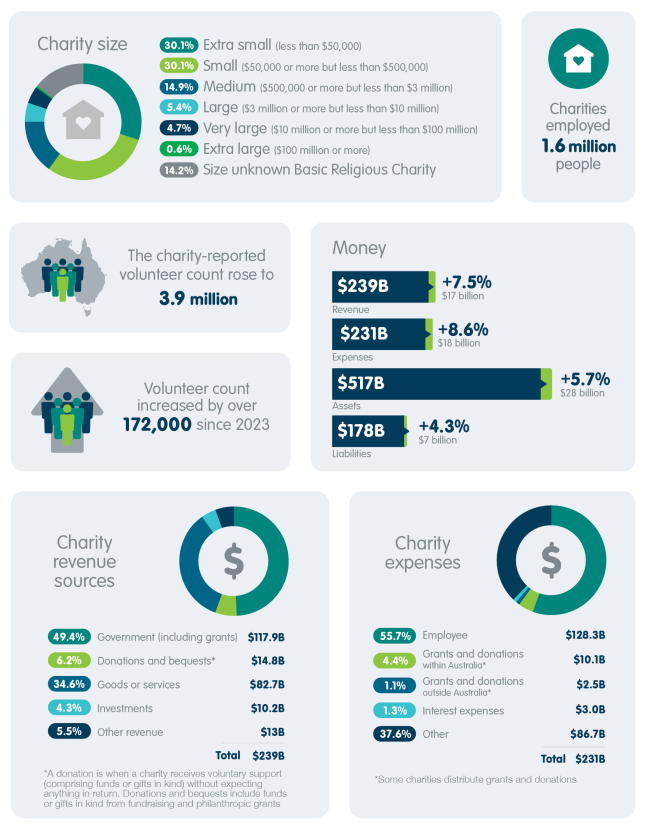
- Charities employed 1.6 million people
- The charity-reported volunteer count rose to 3.9 million
- Volunteer count increased by over 172,000 since 2023
Charity size
- Extra small (less than $50,000): 30.1%
- Small ($50,000 or more but less than $500,000): 30.1%
- Medium ($500,000 or more but less than $3 million): 14.9%
- Large ($3 million or more but less than $10 million): 5.4%
- Very large ($10 million or more but less than $100 million): 4.7%
- Extra large ($100 million or more): 0.6%
- Size unknown (Basic Religious Charity): 14.2%
Charity money
- Revenue: $239 billion (+7.5%, $17 billion)
- Expenses: $231 billion (+8.6%, $18 billion)
- Assets: $517 billion (+5.7%, $28 billion)
- Liabilities: $178 billion (+4.3%, $7 billion)
Charity revenue sources
- Government (including grants): 49.4% ($117.9 billion)
- Donations and bequests*: 6.2% ($14.8 billion)
- Goods or services: 34.6% ($82.7 billion)
- Investments: 4.3% ($10.2 billion)
- Other revenue: 5.5% ($13 billion)
- Total: $239 billion
*A donation is when a charity receives voluntary support (comprising funds or gifts in kind) without expecting anything in return. Donations and bequests include funds or gifts in kind from fundraising and philanthropic grants.
Charity expenses
- Employee: 55.7% ($128.3 billion)
- Grants and donations within Australia*: 4.4% ($10.1 billion)
- Grants and donations outside Australia*: 1.1% ($2.5 billion)
- Interest expenses: 1.3% ($3.0 billion)
- Other: 37.6% ($86.7 billion)
- Total: $231 billion
*Some charities distribute grants and donations
In their Annual Information Statements, charities provide details of the programs or activities that they engage in to achieve their charitable purpose.
Consistent with last year, the three most common charity activity categories were ‘Religion and faith-based spirituality’, ‘Human services’ and ‘Education’.
As was the case last year, the least common activity category was ‘Social sciences’.
The proportion of charities engaged in each of the 19 activity categories remained relatively stable compared to last year. The one exception was the ‘Religion and faith-based spirituality’ category, which fell from 20.3% to 19.8%.
Table 1: CLASSIE Level 1 classifications reported by charities
| CLASSIE classification | Number of programs | % of charities engaged in activity | % of charities engaged in activity previous year |
|---|---|---|---|
| Religion and faith-based spirituality | 20,514 | 19.8 | 20.3 |
| Human services | 16,110 | 15.6 | 15.7 |
| Education | 15,486 | 15.0 | 15.1 |
| Health | 11,818 | 11.4 | 11.3 |
| Community development | 9,886 | 9.5 | 9.4 |
| Arts and culture | 8,675 | 8.4 | 8.1 |
| Environment | 3,485 | 3.4 | 3.2 |
| Economic development | 2,522 | 2.4 | 2.5 |
| Public safety | 2,485 | 2.4 | 2.4 |
| Animal welfare | 2,046 | 2.0 | 1.9 |
| Sport and recreation | 1,806 | 1.7 | 1.6 |
| Human rights | 1,707 | 1.6 | 1.6 |
| Public affairs | 1,170 | 1.1 | 1.1 |
| Information and communications | 896 | 0.9 | 0.8 |
| Agriculture, fisheries and forestry | 879 | 0.8 | 0.9 |
| International activities | 467 | 0.5 | 0.4 |
| Science | 368 | 0.4 | 0.3 |
| Social sciences | 211 | 0.2 | 0.2 |
| Unknown or not classified | 3,029 | 2.9 | 3.0 |
Note: Charities that have operated during the reporting period must provide the ACNC with information on one to 10 programs or activities. Charities are asked to classify these programs or activities using the Classification System of Australian Social Sector Initiatives and Entities (CLASSIE). More information on activity classifications can be found in the Data section.
Those who the charity is there to serve – those who use a charity’s programs – are its beneficiaries. In their 2024 Annual Information Statements, charities could select multiple beneficiary groups for each of their programs.
In the 2024 reporting period, there was a change among the top beneficiary groups. ‘Adults – aged 65 or over’ entered the top three, as the third most common beneficiary group. This is an increase by 0.3 percentage points since the 2020 reporting period.
This change aligns with changing Australian demographics.
Australian Bureau of Statistics (ABS) data shows that between 2000 and 2020, the proportion of the Australian population aged 65 years and over increased from 12.4% to 16.3% and the ABS has projected an even more rapid rise in the decade from 2020–2029.
In the 2024 reporting period, the two most common beneficiary groups remained the same as in the previous year, ‘Adults – aged 25 to under 65’ at 8.1%, and ‘Youth – aged 15 to under 25’ at 7.8%.
‘Families’ fell out of the top three and now sits fourth, 0.1% behind ‘Adults – aged over 65’.
Table 2: Beneficiary groups reported by charities
| Beneficiary name | % this year | % previous year |
|---|---|---|
| Adults – aged 25 to under 65 | 8.1 | 8.1 |
| Youth – aged 15 to under 25 | 7.8 | 7.9 |
| Adults – aged 65 and over | 6.9 | 6.9 |
| Families | 6.8 | 7.0 |
| Females | 6.3 | 6.3 |
| Children – aged 6 to under 15 | 6.1 | 6.2 |
| Males | 5.8 | 5.8 |
| General community in Australia | 5.4 | 5.7 |
| Financially disadvantaged people | 4.9 | 5.0 |
| People in rural/regional/remote communities | 4.7 | 4.7 |
| People from a culturally and linguistically diverse background | 4.7 | 4.7 |
| Aboriginal and Torres Strait Islander people | 4.1 | 4.1 |
| People with disabilities | 4.0 | 4.0 |
| Early childhood – aged under 6 | 4.0 | 4.0 |
| People at risk of homelessness/ people experiencing homelessness | 2.7 | 2.8 |
| Unemployed persons | 2.7 | 2.7 |
| People with chronic illness (including terminal illness) | 2.3 | 2.3 |
| Veterans and/or their families | 1.6 | 1.5 |
| Victims of crime (including family violence) | 1.6 | 1.5 |
| Other charities | 1.5 | 1.3 |
| Victims of disaster | 1.2 | 1.2 |
| Overseas communities or charities | 1.2 | 1.3 |
| Environment | 1.1 | 1.1 |
| Pre/post release offenders and/or their families | 1.0 | 1.0 |
| Animals | 0.8 | 0.8 |
| Migrants, refugees or asylum seekers | 0.7 | 0.7 |
| Other gender identities* | 0.7 | - |
| LGBTIQA+ | 0.7 | 0.6 |
| Other | 0.7 | 0.6 |
Note: Charities were able to select multiple beneficiary groups for each activity they reported on.
*Other gender identities category was added from the 2024 AIS
More than 92% of charities reported that they only operated in a single state or territory, with the remainder operating in more than one state or territory.
However, we note that many of these charities would have an online presence – for example, a website – so this result should be understood in that context – namely, the reach of these charities may be beyond one state or territory even when they only have a physical presence or provide services in one state or territory.
Table 3: Operating locations of charities
| State or territory | % of charities | % of Australia's population at 30 June 2025 |
|---|---|---|
| ACT | 1.6 | 1.8 |
| NSW | 30.8 | 31.1 |
| NT | 1.1 | 1.0 |
| QLD | 15.4 | 20.5 |
| SA | 7.3 | 6.9 |
| TAS | 2.7 | 2.1 |
| VIC | 23.6 | 25.6 |
| WA | 10.0 | 11.0 |
| More than one | 7.6 |
Note: The table does not include any charities that appear to only operate online.
Operations overseas
Slightly more than 3,200 charities (or 6%) operated overseas, a small increase from 5.8% in the previous period.
While the five most common countries of overseas operation did not change from the previous year, the order did.
Table 4: Most common countries of overseas operation, with comparison to previous reporting period
| Ranking | 2024 AIS period | Previous AIS period |
|---|---|---|
| 1st | India | India |
| 2nd | Indonesia | Cambodia |
| 3rd | Philippines | Indonesia |
| 4th | Cambodia | Philippines |
| 5th | Kenya | Kenya |
The charity-reported volunteer count rose to 3.9 million in the 2024 reporting period. This figure is a 4.6% increase on last year and is the largest volunteer count ever reported to the ACNC.
The percentage increase in volunteer count was also well above the rate of growth for Australia’s population which, according to ABS data, sat at 1.5% for the 2024–2025 financial year.
It should be noted that ‘charity-reported volunteer count’ is the total number of volunteers reported by registered charities. It is a charity-level count, so it may count the same person more than once if they volunteered for more than one charity. It also excludes volunteering for not-for-profits that are not registered charities, such as many local sporting clubs.
This is different to how the ABS tracks volunteer numbers. Information about population-based rates of volunteering can be found in the ABS’s General Social Survey, which asks individuals if they participated in unpaid voluntary work. This includes both volunteering through an organisation (which may or may not be a registered charity), and informal volunteering.
Clean Up Australia Limited, which operates nationally, again reported the largest number of volunteers for a single charity – 1.1 million people (an increase of around 47,000 on the previous year). Surf Life Saving clubs across Australia reported drawing on the efforts of more than 250,000 volunteers.
The number of people employed by charities (including full-time, part-time and casual staff) grew by almost 64,000.
Charities employed 1.6 million people in 2024 – 11% of the entire Australian workforce, and an increase from 10.7% recorded in the previous year.
The biggest employers were schools, healthcare providers and charities delivering services in the broader care and support sector.
Based on ABS data from May 2025, charities continued to employ more people than the manufacturing, construction and retail trade sectors.
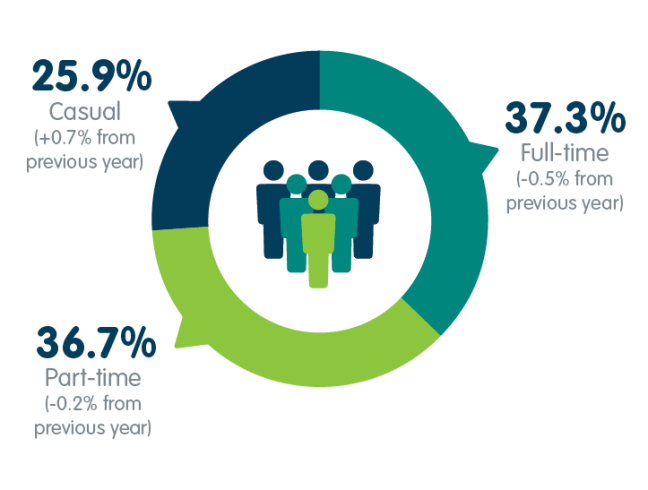
Full-time: 37.3% (-0.5% from previous year)
Part-time: 36.7% (-0.2% from previous year)
Casual: 25.9% (+0.7% from previous year)
Around 37% of employees were full-time, and 37% were part-time.
The proportion of casual employees increased 0.7% – from 25.2% to 25.9% – compared to the previous year.
Overall, charities continue to be far more reliant on volunteers than paid staff. On average, charities rely on 2.5 volunteers for every employee. Nearly 53% of charities operate with no paid staff, an increase of almost 1% on the previous year.
Table 5: Charity-reported volunteer count and number of employees, with changes from previous year
| Total | Change from previous year | % change from previous year | |
|---|---|---|---|
| Volunteers | 3,937,611 | 172,392 | 4.6 |
| Employees | 1,602,996 | 63,821 | 4.1 |
Notes:
Charities report on the number of volunteers that helped their charity in the 2024 reporting period. This includes one off and regular volunteers.
Charities report employee numbers based on the most recent pay period of their most recent reporting period.
Table 6: Volunteer to employee ratio and percentage of charities operating with no paid staff, with changes from previous year
| Total | Change from previous year | |
|---|---|---|
| Volunteer to employee ratio | 2.5 | 0.1 |
| % of charities with no paid staff | 52.9 | 0.8 |
Table 7: Number of employees by type of employment
| Number | Change from previous year | |
|---|---|---|
| Full-time | 598,332 | 16,054 |
| Part-time | 589,001 | 20,047 |
| Casual | 415,663 | 27,720 |
| Total | 1,602,996 | 63,821 |
Overview
ACNC legislation defines three charity size categories based on annual revenue. All charities (including Basic Religious Charities) report their size to the ACNC – small, medium or large.
This year, the proportion of small charities decreased to 73% from the 73.5% recorded in the previous year.
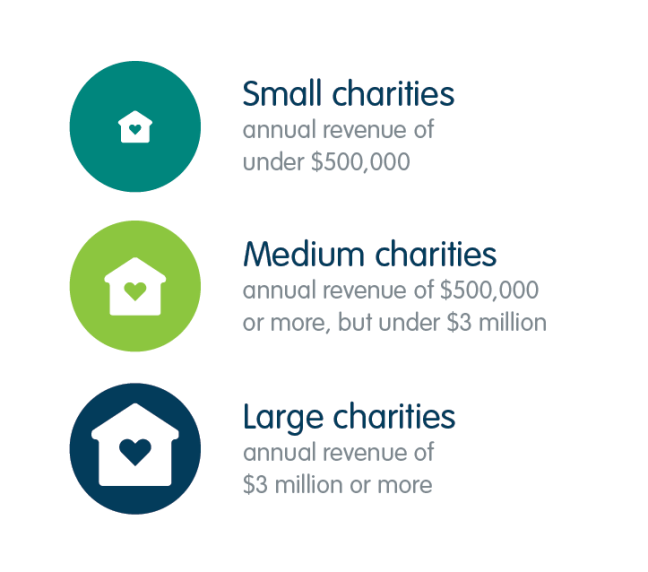
Medium charities: annual revenue of $500,000 or more, but under $3 million
Large charities: annual revenue of $3 million or more
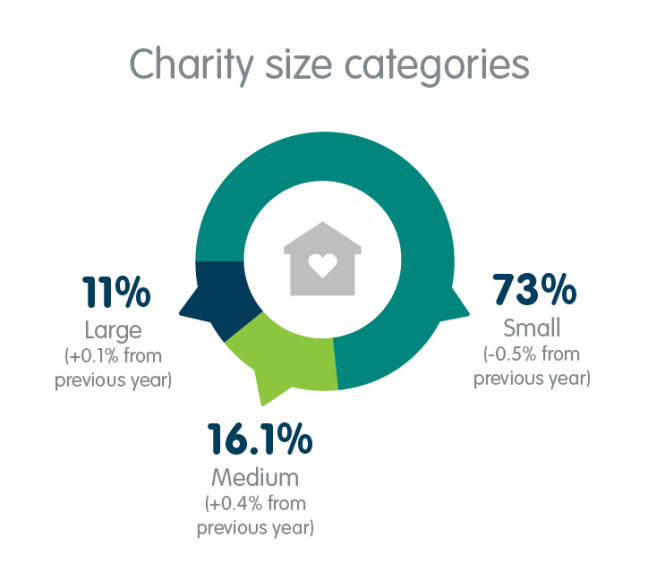
Small: 73% (-0.5% from previous year)
Medium: 16.1% (+0.4% from previous year)
Large: 11% (+0.1% from previous year)
Charities reported a record $239 billion in revenue, $244 billion in income and $231 billion in expenses.
The growth in revenue (7.5%) outpaced the wider Australian economy, with the Australian Bureau of Statistics reporting that the Australian economy grew by 1.4% in the financial year ending 30 June 2025.
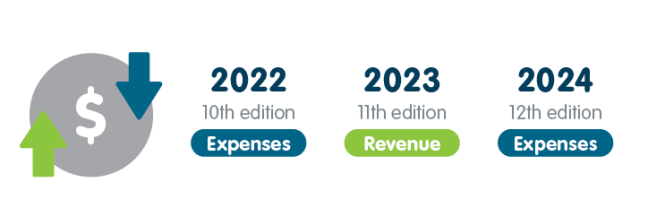
2022 (10th edition): Expenses
2023 (11th edition): Revenue
2024 (12th edition): Expenses
Growth in revenue and expenses — measured in both percentage terms and absolute dollars – continued to fluctuate, reflecting ongoing volatility due to increased demand on the charity sector and broader economic factors.
Charities reported assets of $517 billion (an increase of 5.7% from the previous year).
Assets include cash, shares, property and equipment. Liabilities – which include amounts owed to suppliers, bank loans and employee entitlements – totalled $178 billion (an increase of 4.3% from the previous year).
Overall, charities had an asset ratio of 2.9, meaning that they held nearly three times as many assets as they owed in liabilities. This helps ensure charities’ financial sustainability.
Table 8: Total income and expenses, with changes from previous year
| Million ($) | Change from previous year ($ million) | % change from previous year | |
|---|---|---|---|
| Total revenue | 238,633 | 16,567 | 7.5 |
| Total income | 244,188 | 17,992 | 8.0 |
| Total expenses | 230,672 | 18,352 | 8.6 |
| Net income | 13,516 | −360 | −2.6 |
Table 9: Total assets and liabilities, with changes from previous year
| Million ($) | Change from previous year ($ million) | % change from previous year | |
|---|---|---|---|
| Total assets | 516,758 | 27,820 | 5.7 |
| Total liabilities | 177,585 | 7,382 | 4.3 |
| Net assets/liabilities | 339,173 | 20,436 | 6.4 |
Table 10: Asset ratio, with changes from previous year
| Ratio | Change from previous year | |
|---|---|---|
| Asset ratio | 2.9 | <0.1 |
Revenue sources
Charities remain most reliant on government as a revenue source.
Around $118 billion – or more than 49% – of the sector’s revenue came from government.
This was an increase of more than $10 billion compared to the previous year.
Goods and services that charities delivered also generated significant revenue; in fact, $83 billion or 35% of the sector’s revenue.
Charities reported receiving $14.8 billion in donations and bequests.
This figure is the second highest ever recorded, exceeded only by last year’s $18.9 billion which was driven by the largest donation ($4.9 billion) to a single charity ever reported to the ACNC. Without this single donation, revenue in the previous reporting period would have been $14 billion and the 2024 reporting period would represent an increase to $14.8 billion.
Table 11: Revenue sources, with changes from previous year
| Million ($) | Change from previous year ($ million) | % change from previous year | |
|---|---|---|---|
| Government (including grants) | 117,916 | 10,423 | 9.7 |
| Donations and bequests | 14,767 | −4,161* | −22.0* |
| Goods or services | 82,680 | 8,818 | 11.9 |
| Investments | 10,226 | 2,669 | 35.3 |
| Other | 13,044 | −1,182 | −8.3 |
*Last year’s figures included a large donation of $4.9 billion to a single charity
Table 12: Revenue sources as a percentage of total revenue, with changes from previous year
| % | % change from previous year | |
|---|---|---|
| Government (including grants) | 49.4 | 1.0 |
| Donations and bequests | 6.2 | −2.3 |
| Goods or services | 34.6 | 1.4 |
| Investments | 4.3 | 0.9 |
| Other | 5.5 | −0.9 |
When reporting, charities allocate their revenue to specific sources. The level of detail about the sources varies depending on a charity’s size (for example, reporting on income from goods or services is optional for small charities). See the Data section of this report for further information.
Expenses
Charities spent $128 billion on employee expenses, a 10% increase from the previous year.
Around 56% of the sector’s expenses relate to employees – not particularly surprising given the number of people employed by charities also grew by 64,000, with charities now employing 1.6 million people.
Charities spent $12.6 billion on grants and donations. Most of this giving came from ancillary funds and trusts – types of registered charities that exist to distribute grants and donations to other charities and charitable causes.
Of this $12.6 billion, $10.1 billion – or around 80% – was distributed within Australia, while the other 20%was distributed outside Australia.
The sector reported a large increase in interest expenses, likely due to higher interest rates during the reporting period.
Table 13: Expense types, with changes from previous year
| Million ($) | Change from previous year ($ million) | % change from previous year | |
|---|---|---|---|
| Employee | 128,394 | 11,458 | 9.8 |
| Grants and donations within Australia* | 10,093 | 285 | 2.9 |
| Grants and donations outside Australia* | 2,480 | 12 | 0.5 |
| Interest | 2,971 | 477.5 | 19.2 |
| Other | 86,735 | 6,119 | 7.6 |
*Some charities distribute grants and donations
Table 14: Expense types as a percentage of total expenses, with changes from previous year
| % | % change from previous year | |
|---|---|---|
| Employee | 55.7 | 0.6 |
| Grants and donations within Australia* | 4.4 | −0.2 |
| Grants and donations outside Australia* | 1.1 | −0.1 |
| Interest | 1.3 | 0.1 |
| Other | 37.6 | −0.4 |
*Some charities distribute grants and donations
In addition to their obligations to the ACNC, many charities have obligations to other regulators.
According to charities’ Annual Information Statements, around 39% of charities are established as incorporated associations, meaning they have obligations to state and territory fair trading regulators. The percentage of incorporated associations is based on the number of charities that voluntarily provided us with an incorporated association number.
The percentage of charities that fundraise is based on the number of charities that voluntarily provided us with a fundraising licence number. Not all charities that conduct public fundraising are required to have a fundraising licence – depending on where a charity undertakes fundraising activities, it may be exempt from the requirement to hold a fundraising licence.
Around 2.5% of charities are NDIS providers.
The percentage of charities that are aged care providers is based on charities’ legal names as registered with the Department of Health. Data for ancillary funds, aged care providers, higher education providers and NDIS providers is drawn from publicly available datasets.
The ACNC continues to work with other regulators to remove duplicated reporting obligations, and to streamline the way charities report to government.
More information about our work reducing red tape for charities can be found on our website.
Table 15: Percentage of charities with reporting obligations to other regulators
| Type of charity | Other regulator | % that report to other regulator |
|---|---|---|
| Incorporated associations | State or territory regulator | 39.2 |
| Charities that fundraise | State or territory regulator | 15.9 |
| Non-government schools | Department of Education (Commonwealth) | 2.4 |
| Ancillary funds | Australian Taxation Office | 5.6 |
| Aged care providers | Department of Health (Commonwealth) | 0.7 |
| Higher education providers | Tertiary Education Quality and Standards Agency (Commonwealth) | 0.1 |
| National Disability Insurance Scheme (NDIS) providers | NDIS Quality and Safeguards Commission | 2.5 |
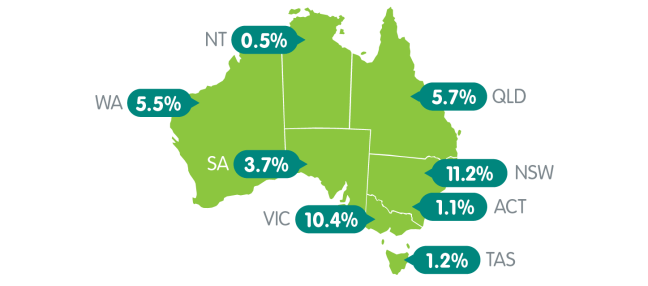
ACT: 1.1%
NSW: 11.2%
NT: 0.5%
QLD: 5.7%
SA: 3.7%
TAS: 1.2%
VIC: 10.4%
WA: 5.5%
Section 2: Analysis based on charity size
Introduction
Charities can range from small organisations such as local churches, Landcare groups, Surf Life Saving clubs and community sheds to large organisations such as universities, schools and hospitals.
This section of the report presents analysis based around six charity sizes (based on revenue) to illustrate the diversity and variety in the charity sector.
Table 16: Charity sizes used in this section of the report, with changes from previous year
| Size | Total revenue | % of charities | % change from previous year |
|---|---|---|---|
| Extra small | Less than $50,000 | 30.1 | -0.2 |
| Small | $50,000 or more but less than $500,000 | 30.1 | 0.2 |
| Medium | $500,000 or more but less than $3 million | 14.9 | 0.4 |
| Large | $3 million or more but less than $10 million | 5.4 | 0.0 |
| Very large | $10 million or more but less than $100 million | 4.7 | 0.1 |
| Extra large | $100 million or more | 0.6 | 0.1 |
| Size unknown – Basic Religious Charity | No financial information provided | 14.2 | -0.5 |
Basic Religious Charities (BRCs) are not required to provide financial information in their Annual Information Statements. BRCs that voluntarily provided financial information have been categorised to one of the sizes listed above based on their revenue.
Further information on BRCs is available in the Data section.
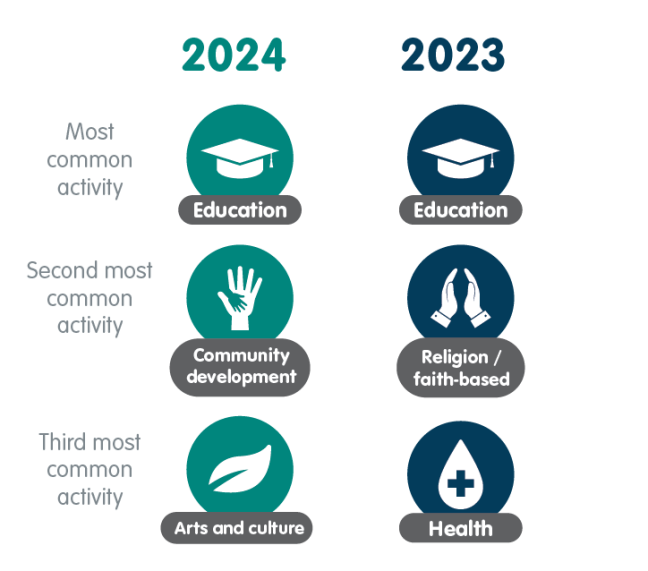
2024
Most common activity: Education
Second most common activity: Community development
Third most common activity: Arts and culture
2023
Most common activity: Education
Second most common activity: Religion/faith-based
Third most common activity: Health
Larger charities tend to focus on the provision of human services, education and health. This is unsurprising given that large charities generally include schools, universities, hospitals and aged care facilities.
Extra small charities experienced the most changes to their activity focus, although the difference between the third and fifth most common activities focus was just 0.1 percentage points.
Among extra small charities, ‘Education’ remained the most common activity category. ‘Community development’ and ‘Arts and culture’ rose to become the second and third most common activities, while ‘Health’ – previously third – fell to fourth. ‘Religion and faith-based spirituality’, which was previously second, dropped to fifth.
Among charities of all sizes – except extra large charities – the least common charity activity was ‘Social sciences’.
Table 17: The three most common and least common CLASSIE Level 1 classifications by charity size
| Size | Activity categories | |||
|---|---|---|---|---|
| Most common | Second most common | Third most common | Least common | |
| Extra small | Education (15.8%) | Community development (12.5%) | Arts and culture (12.2%) | Social sciences (0.3%) |
| Small | Religion and faith-based spirituality (18.1%) | Education (14.3%) | Human services (13.9%) | Social sciences (0.2%) |
| Medium | Human services (18.8%) | Education (18.1%) | Health (12.7%) | Social sciences (0.3%) |
| Large | Human services (24.6%) | Education (19.5%) | Health (16.6%) | Social sciences (0.2%) |
| Very large | Human services (31.4%) | Education (21.3%) | Health (20.1%) | Social sciences (0.2%) |
| Extra large | Human services (37.8%) | Health (22.2%) | Education (21.1%) | Animal welfare (0.1%) |
Except for extra large charities, ‘Adults – aged 25 to under 65’ and ‘Youth – aged 15 to under 25’ were the two most common beneficiary groups across all charity sizes.
Large charities reported ‘Aboriginal and Torres Strait Islander people’ as the third most common beneficiary group – that group ranked fourth in the previous year.
Table 18: The three most common beneficiary groups by charity size
| Size | Most common | Second most common | Third most common |
|---|---|---|---|
| Extra small | Adults – aged 25 to under 65 (8.8%) | Youth – aged 15 to under 25 (7.8%) | Families (7.4%) |
| Small | Adults – aged 25 to under 65 (8.5%) | Youth – aged 15 to under 25 (8.1%) | Families (7.3%) |
| Medium | Youth – aged 15 to under 25 (7.7%) | Adults – aged 25 to under 65 (7.7%) | Females (6.4%) |
| Large | Youth – aged 15 to under 25 (7.9%) | Adults – aged 25 to under 65 (7.3%) | Aboriginal and Torres Strait Islander people (6.4%) |
| Very large | Youth – aged 15 to under 25 (8.8%) | Adults – aged 25 to under 65 (7.0%) | Adults – aged 65 and over (6.6%) |
| Extra large | Youth – aged 15 to under 25 (8.7%) | Adults – aged 65 and over (8.4%) | Adults – aged 25 to under 65 (7.9%) |
The charity-reported volunteer count increased for all sizes, except for very large charities.
Only very large and extra large charities reported an increase in employees. Extra large charities recorded a significant increase in employees – up 8.5% compared to the previous year.
The reduction in the volunteer count for very large sized charities (as shown in the following table) can be attributed to one charity designated as very large in 2023 shifting to small in 2024, rather than a broader trend across the sector.
Extra small charities are the most reliant on volunteers: more than 89% operated without any paid staff and, as a cohort, they had the highest volunteer to employee ratio (around one employee to 33 volunteers).
For those extra small charities that employed staff, more than 50% were casual employees. This is likely to reflect their limited financial resources.
The charity-reported volunteer count may count the same person more than once if they volunteered for more than one charity. It also excludes volunteering for not-for-profits that are not registered charities.
Table 19: Charity-reported volunteer count and employee numbers by charity size, with changes from previous year
Volunteers | Employees | Volunteer to employee ratio | ||||||
|---|---|---|---|---|---|---|---|---|
| Size | Total | Change | % change from previous year | Total | Change | % change from previous year | Ratio | % change |
| Extra small | 245,072 | 22,716 | 10.2 | 7,484 | −1,319* | −15.0 | 32.7 | 7.5 |
| Small | 630,855 | 26,847 | 4.1 | 30,198 | −1,219* | −3.9 | 20.9 | 1.6 |
| Medium | 565,380 | 23,397 | 4.2 | 91,057 | −2,859* | −3.0 | 6.2 | 0.4 |
| Large | 1,413,538 | 81,186 | 6.1 | 128,202 | −1,840 | −1.4 | 11.0 | 0.8 |
| Very large | 608,727 | −10,947 | −1.8 | 508,262 | 6,615 | 1.3 | 1.2 | 0.0 |
| Extra large | 191,879 | 25,754 | 15.5 | 820,353 | 64,530 | 8.5 | 0.2 | 0.0 |
| Unknown – BRC | 282,160 | 3,439 | 2.0 | 17,440 | −87* | −0.5* | 16.2 | 0.4 |
| Total | 3,937,611 | 172,392 | 4.6 | 1,602,996 | 63,821 | 4.1 | 2.5 | 0.1 |
*As part of our quality assurance when analysing data for this edition of the Charities Report, we identified minor errors. We have used corrected figures when comparing 2024 data with 2023.
Notes:
Charities report on the number of volunteers that helped their charity in the 2024 reporting period. This includes one off and regular volunteers.
Charities report employee numbers based on the most recent pay period of their most recent reporting period.
Table 20: Operating charities with no employees by charity size, with changes from previous year
| Size | % operating with no employees | % change from the previous year |
|---|---|---|
| Extra small | 89.3 | 0.9 |
| Small | 54.7 | 1.9 |
| Medium | 18.9 | 1.5 |
| Large | 8.8 | −0.3 |
| Very large | 4.9 | −0.4 |
| Extra large | 2.0 | 0.2 |
| Unknown – BRC | 48.9 | −0.3 |
| Total | 52.9 | 0.8 |
Table 21: Number of employees by charity size, with changes from previous year
Full-time | Part-time | Casual | ||||
|---|---|---|---|---|---|---|
| Size | Number | Change from previous year | Number | Change from previous year | Number | Change from previous year |
| Extra small | 1,510 | −285* | 2,133 | −1,021* | 3,841 | −13* |
| Small | 4,961 | −120* | 11,378 | −818* | 13,859 | −281* |
| Medium | 23,028 | −1,504* | 36,634 | −1,015* | 31,395 | −340* |
| Large | 41,205 | −1,507 | 48,490 | −2,062 | 38,507 | 1,729 |
| Very large | 201,590 | 2,149 | 182,742 | 4,079 | 123,930 | 387 |
| Extra large | 320,040 | 17,572 | 299,827 | 20,806 | 200,486 | 26,152 |
| Unknown – BRC | 5,998 | −251* | 7,797 | 78* | 3,645 | 86* |
| Total | 598,332 | 16,054 | 589,001 | 20,047 | 415,663 | 27,720 |
*As part of our quality assurance when analysing data for this edition of the Charities Report, we identified minor errors. We have used corrected figures when comparing 2024 data with 2023.
Table 22: Type of employment by charity size, with changes from previous year
Full-time | Part-time | Casual | ||||
|---|---|---|---|---|---|---|
| Size | % of total staff | Change from previous year | % of total staff | Change from previous year | % of total staff | Change from previous year |
| Extra small | 20.2 | −0.2* | 28.5 | −7.3* | 51.3 | 7.5 |
| Small | 16.4 | 0.2* | 37.7 | −1.1 | 45.9 | 0.9 |
| Medium | 25.3 | −0.8 | 40.2 | 0.1 | 34.5 | 0.7 |
| Large | 32.1 | −0.7 | 37.8 | −1.1 | 30.0 | 1.8 |
| Very large | 39.7 | −0.1 | 36.0 | 0.3 | 24.4 | −0.2 |
| Extra large | 39.0 | −1.0 | 36.5 | −0.4 | 24.4 | 1.4 |
| Unknown – BRC | 34.4 | −1.3* | 44.7 | 0.7* | 20.9 | 0.6 |
| Total | 37.3 | −0.5 | 36.7 | −0.2 | 25.9 | 0.7 |
*As part of our quality assurance when analysing data for this edition of the Charities Report, we identified minor errors. We have used corrected figures when comparing 2024 data with 2023.
Overview
While all charity sizes recorded revenue growth, extra large charities – those with revenue of $100 million or more – continued to generate the majority of the sector’s income.
Although they represented only 0.6% of all charities, extra large charities accounted for more than 57% of total sector revenue.
In contrast, extra small charities made up around one third of the sector, yet contributed just 0.1% of total revenue.
As charities increase in size, they tend to rely less on donations and bequests and more on government funding and revenue from providing goods or services.
Most charity sizes reported an increase in expenses, except extra small charities.
Only small, very large and extra large charities reported growth in assets. Small and extra small charities had the highest asset ratio across the six charity sizes, indicating they had significant reserves to rely on.
Extra small
While extra small charities represented 30% of the sector, they reported just 0.1% of the sector’s revenue and held only 0.8% of the sector’s assets.
Charities in the extra small category size were the only ones to report a decrease in total expenses. Extra small charities were also the only ones to report a decrease in employee expenses, reflecting a reduction in their employment of staff.
In addition to reporting a significant decrease in assets, extra small charities also reported a decrease in liabilities. But these charities still held seven times more in assets than liabilities, indicative of them having reserves to rely on.
Extra small charities continued to be the charity size group most reliant on donations and bequests for funding.
This revenue source generated slightly less than 39% of their revenue. Almost 56% of extra small charities reported receiving some donations or bequests.
Table 23: Key financial information for extra small charities, with changes from previous year
| Total ($ million) | Change ($ million) from previous year | % change from previous year | Proportion of total sector | |
|---|---|---|---|---|
| Revenue | 237 | 7 | 3.1 | 0.1% |
| Income | 303 | 1 | 0.3 | 0.1% |
| Expenses | 374 | −73 | −16.3 | 0.2% |
| Net surplus/deficit | −71 | 74 | 51.1 | |
| Assets | 4,243 | −1,151 | −21.3 | 0.8% |
| Liabilities | 599 | −50 | −7.7 | 0.3% |
| Net assets/liabilities | 3,644 | −1,101 | −23.2 | |
| Asset ratio: 7.1 | ||||
Table 24: Revenue sources for extra small charities, with changes from previous year
Total | Proportion of total revenue | ||||
|---|---|---|---|---|---|
| Million ($) | Change ($ million) from previous year | % change from previous year | % | % change from previous year | |
| Government (including grants) | 19 | 0 | 1.7 | 8.0 | −0.1 |
| Donations and bequests | 91 | −1 | −0.9 | 38.6 | −1.6 |
| Goods or services | 56 | 3 | 5.1 | 23.7 | 0.4 |
| Investments | 41 | 5 | 13.8 | 17.3 | 1.6 |
| Other | 29 | 0 | 0.0 | 12.4 | −0.4 |
Table 25: Percentage of extra small charities receiving revenue from each revenue source, with changes from previous year
| % | % change from the previous year | |
|---|---|---|
| Government (including grants) | 13.8 | 0.6 |
| Donations and bequests | 55.8 | −0.2 |
| Goods or services | 32.6 | 1.2 |
| Investments | 36.1 | 1.0 |
| Other | 33.9 | 1.5 |
Table 26: Expense types for extra small charities, with changes from previous year
Total | Proportion of total expenses | ||||
|---|---|---|---|---|---|
| Million ($) | Change ($ million) from previous year | % change from previous year | % | % change from previous year | |
| Employee | 33 | −3 | −7.1 | 8.8 | 0.9 |
| Grants and donations within Australia* | 103 | −31 | −22.9 | 27.6 | −2.4 |
| Grants and donations outside Australia* | 22 | −1 | −3.1 | 6.0 | 0.8 |
| Other | 215 | −39 | −15.3 | 57.6 | 0.7 |
*Some charities distribute grants and donations
Small
Around 30% of Australia’s charities are small. They generate almost $3.1 billion in revenue, and account for 1.3% of the sector’s total revenue.
For these charities, revenue from government was the only source of revenue to decrease from the previous year, down by $30 million (6%).
Slightly more than 29% of these charities reported receiving revenue from government, while nearly 75% reported receiving revenue through donations and bequests.
While small charities reported a significant percentage increase in liabilities, growth in assets continued to exceed liabilities in absolute dollars.
Table 27: Key financial information for small charities, with changes from previous year
| Total ($ million) | Change ($ million) from previous year | % change from previous year | Proportion of total sector | |
|---|---|---|---|---|
| Revenue | 3,075 | 70 | 2.3 | 1.3% |
| Income | 3,335 | 116 | 3.6 | 1.4% |
| Expenses | 3,121 | 56 | 1.8 | 1.4% |
| Net surplus/deficit | 214 | 59 | 38.1 | |
| Assets | 19,008 | 1,386 | 7.9 | 3.7% |
| Liabilities | 2,263 | 417 | 22.6 | 1.3% |
| Net assets/liabilities | 16,745 | 969 | 6.1 | |
| Asset ratio: 8.4 | ||||
Table 28: Revenue sources for small charities, with changes from previous year
Total | Proportion of total revenue | ||||
|---|---|---|---|---|---|
| Million ($) | Change ($ million) from previous year | % change from previous year | % | % change from previous year | |
| Government (including grants) | 466 | −30 | −6.0 | 15.2 | −1.3 |
| Donations and bequests | 1,176 | 41 | 3.6 | 38.3 | 0.5 |
| Goods or services | 752 | 19 | 2.7 | 24.4 | 0.1 |
| Investments | 391 | 37 | 10.5 | 12.7 | 0.9 |
| Other | 290 | 2 | 0.6 | 9.4 | −0.2 |
Table 29: Percentage of small charities receiving revenue from each revenue source, with changes from previous year
| % | % change from the previous year | |
|---|---|---|
| Government (including grants) | 29.1 | −1.2 |
| Donations and bequests | 74.9 | 0.7 |
| Goods or services | 51.6 | −0.5 |
| Investments | 54.5 | 1.4 |
| Other | 48.4 | 0.3 |
Table 30: Expense types for small charities, with changes from previous year
Total | Proportion of total expenses | ||||
|---|---|---|---|---|---|
| Million ($) | Change ($ million) from previous year | % change from previous year | % | % change from previous year | |
| Employee | 859 | 35 | 4.3 | 27.5 | 0.6 |
| Grants and donations within Australia* | 593 | 26 | 4.6 | 19.0 | 0.5 |
| Grants and donations outside Australia* | 128 | −1 | −1.1 | 4.1 | −0.1 |
| Other | 1,541 | −3 | −0.2 | 49.4 | −1.0 |
*Some charities distribute grants and donations
Medium
Medium charities comprise 15% of the sector, and account for 4.3% of the sector’s revenue.
For these charities, growth in expenses exceeded growth in revenue – both in percentage terms, and in absolute dollars.
Expenses grew by $629 million (or 7%), while, in comparison, revenue grew by $515 million (or 5.3%).
Apart from revenue from goods and services – which saw a marginal $14 million (0.5%) decline – all other revenue sources increased. Medium charities reported the highest percentage increase in donations, up 8.9% to nearly $2.5 billion.
Of the six charity size groups, medium charities also reported the largest increase in grants and donations within Australia (in absolute dollars, as well as in percentage terms).
This figure increased by $218 million, or around 25%, on the previous year.
Table 31: Key financial information for medium charities, with changes from previous year
| Total ($ million) | Change ($ million) from previous year | % change from previous year | Proportion of total sector | |
|---|---|---|---|---|
| Revenue | 10,235 | 515 | 5.3 | 4.3% |
| Income | 10,664 | 567 | 5.6 | 4.4% |
| Expenses | 9,672 | 629 | 7.0 | 4.2% |
| Net surplus/deficit | 992 | −62 | −5.9 | |
| Assets | 35,948 | −392 | −1.1 | 7.0% |
| Liabilities | 5,443 | −634 | −10.4 | 3.1% |
| Net assets/liabilities | 30,505 | 242 | 0.8 | |
| Asset ratio: 6.6 | ||||
Table 32: Revenue sources for medium charities, with changes from previous year
Total | Proportion of total revenue | ||||
|---|---|---|---|---|---|
| Million ($) | Change ($ million) from previous year | % change from previous year | % | % change from previous year | |
| Government (including grants) | 3,430 | 95 | 2.9 | 33.5 | −0.8 |
| Donations and bequests | 2,447 | 201 | 8.9 | 23.9 | 0.8 |
| Goods or services | 2,803 | −14 | −0.5 | 27.4 | −1.6 |
| Investments | 903 | 195 | 27.5 | 8.8 | 1.5 |
| Other | 650 | 39 | 6.3 | 6.4 | 0.1 |
Table 33: Percentage of medium charities receiving revenue from each revenue source, with changes from previous year
| % | % change from the previous year | |
|---|---|---|
| Government (including grants) | 58.3 | −2.1 |
| Donations and bequests | 72.0 | 0.5 |
| Goods or services | 70.0 | −1.5 |
| Investments | 71.9 | 3.2 |
| Other | 62.1 | −0.6 |
Table 34: Expense types for medium charities, with changes from previous year
Total | Proportion of total expenses | ||||
|---|---|---|---|---|---|
| Million ($) | Change ($ million) from previous year | % change from previous year | % | % change from previous year | |
| Employee | 4,587 | 167 | 3.8 | 47.4 | −1.5 |
| Grants and donations within Australia* | 1,107 | 218 | 24.5 | 11.4 | 1.6 |
| Grants and donations outside Australia* | 264 | 44 | 19.8 | 2.7 | 0.3 |
| Other | 3,713 | 200 | 5.7 | 38.4 | −0.5 |
*Some charities distribute grants and donations
Large
Around 5.4% of charities are large. They generate more than $16 billion in revenue, which accounts for 6.8% of the sector’s total revenue.
Of all charity size categories, large charities reported the smallest percentage increase in revenue (2.2%).
They also reported the second smallest change in expenses (behind charities in the extra small category).
Nearly 43% of large charities’ revenue came from government, with another 32% coming from goods or services. Around 55% of large charities’ expenses related to employees.
Table 35: Key financial information for large charities, with changes from previous year
| Total ($ million) | Change ($ million) from previous year | % change from previous year | Proportion of total sector | |
|---|---|---|---|---|
| Revenue | 16,302 | 355 | 2.2 | 6.8% |
| Income | 16,897 | 396 | 2.4 | 6.9% |
| Expenses | 15,258 | 230 | 1.5 | 6.6% |
| Net surplus/deficit | 1,640 | 166 | 11.3 | |
| Assets | 39,147 | −1,438 | −3.5 | 7.6% |
| Liabilities | 8,750 | −1,713 | −16.4 | 4.9% |
| Net assets/liabilities | 30,397 | 275 | 0.9 | |
| Asset ratio: 4.5 | ||||
Table 36: Revenue sources for large charities, with changes from previous year
Total | Proportion of total revenue | ||||
|---|---|---|---|---|---|
| Million ($) | Change ($ million) from previous year | % change from previous year | % | % change from previous year | |
| Government (including grants) | 6,958 | −79 | −1.1 | 42.7 | −1.4 |
| Donations and bequests | 2,315 | 168 | 7.8 | 14.2 | 0.7 |
| Goods or services | 5,225 | 250 | 5.0 | 32.1 | 0.9 |
| Investments | 887 | 44 | 5.3 | 5.4 | 0.2 |
| Other | 917 | −28 | −3.0 | 5.6 | −0.3 |
Table 37: Percentage of large charities receiving revenue from each revenue source, with changes from previous year
| % | % change from the previous year | |
|---|---|---|
| Government (including grants) | 71.6 | −2.0 |
| Donations and bequests | 68.4 | 0.3 |
| Goods or services | 81.0 | 0.3 |
| Investments | 81.4 | 1.5 |
| Other | 75.0 | −1.3 |
Table 38: Expense types for large charities, with changes from previous year
Total | Proportion of total expenses | ||||
|---|---|---|---|---|---|
| Million ($) | Change ($ million) from previous year | % change from previous year | % | % change from previous year | |
| Employee | 8,378 | 293 | 3.6 | 54.9 | 1.1 |
| Grants and donations within Australia* | 1,012 | 55 | 5.8 | 6.6 | 0.3 |
| Grants and donations outside Australia* | 318 | −9 | −2.7 | 2.1 | −0.1 |
| Interest | 136 | −51 | −27.1 | 0.9 | −0.4 |
| Other | 5,414 | −59 | −1.1 | 35.5 | −0.9 |
Note: Only large, very large and extra large charities are required to report on interest expenses. Further information on charity reporting by size is available in the Data section.
*Some charities distribute grants and donations
Very large
Very large charities comprise 4.7% of the sector, but make up more than 30% of the sector’s total revenue and hold 29% of the sector’s assets.
Of the six charity size categories, very large charities recorded the largest total donations and bequests figure – $5.7 billion.
This represents around 39% of all donations and bequests received by all Australian charities.
Very large charities derived 36.4% of their revenue from goods or services – the largest across all charity size categories.
More than 57% of these charities’ expenses were employee-related. This was the largest proportion dedicated to this expense across all charity size categories.
Table 39: Key financial information for very large charities, with changes from previous year
| Total ($ million) | Change ($ million) from previous year | % change from previous year | Proportion of total sector | |
|---|---|---|---|---|
| Revenue | 72,522 | 3,780 | 5.5 | 30.4% |
| Income | 74,557 | 4,305 | 6.1 | 30.5% |
| Expenses | 68,743 | 4,181 | 6.5 | 29.8% |
| Net surplus/deficit | 5,815 | 124 | 2.2 | |
| Assets | 151,094 | 7,976 | 5.6 | 29.2% |
| Liabilities | 51,696 | 3,783 | 7.9 | 29.1% |
| Net assets/liabilities | 99,398 | 4,186 | 4.4 | |
| Asset ratio: 2.9 | ||||
Table 40: Revenue sources for very large charities, with changes from previous year
Total | Proportion of total revenue | ||||
|---|---|---|---|---|---|
| Million ($) | Change ($ million) from previous year | % change from previous year | % | % change from previous year | |
| Government (including grants) | 34,120 | 2,000 | 6.2 | 47.0 | 0.3 |
| Donations and bequests | 5,700 | 112 | 2.0 | 7.9 | −0.3 |
| Goods or services | 26,391 | 1,160 | 4.6 | 36.4 | −0.3 |
| Investments | 2,666 | 459 | 20.8 | 3.7 | 0.5 |
| Other | 3,645 | 49 | 1.4 | 5.0 | −0.2 |
Table 41: Percentage of very large charities receiving revenue from each revenue source, with changes from previous year
| % | % change from the previous year | |
|---|---|---|
| Government (including grants) | 86.1 | −0.3 |
| Donations and bequests | 67.5 | −0.1 |
| Goods or services | 86.5 | 0.0 |
| Investments | 87.0 | 0.5 |
| Other | 81.3 | −0.1 |
Table 42: Expense types for very large charities, with changes from previous year
Total | Proportion of total expenses | ||||
|---|---|---|---|---|---|
| Million ($) | Change ($ million) from previous year | % change from previous year | % | % change from previous year | |
| Employee | 39,361 | 2,612 | 7.1 | 57.3 | 0.3 |
| Grants and donations within Australia* | 3,104 | 111 | 3.7 | 4.5 | −0.1 |
| Grants and donations outside Australia* | 1,081 | 47 | 4.6 | 1.6 | 0.0 |
| Interest | 869 | 212 | 32.2 | 1.3 | 0.2 |
| Other | 24,328 | 1,199 | 5.2 | 35.4 | −0.4 |
Note: Only large, very large and extra large charities are required to report on interest expenses. Further information on charity reporting by size is available in the Data section.
*Some charities distribute grants and donations
Extra large
While extra large charities comprised 0.6% of the sector, they accounted for 57% of the sector’s revenue and held around 51% of the sector’s assets.
Charities in this size category showed the strongest percentage increases in revenue, expenses and assets.
The revenue growth was driven by revenue from government, and revenue from goods or services.
Extra large charities were the only charity size category to receive more than half of their revenue from government.
They reported receiving $73 billion in revenue from government (more than 53% of the total revenue they received) – a figure that marked an $8.4 billion (13%) increase on the previous year.
Employee expenses for extra large charities grew by 12.5% – an increase in line with a significant jump in employee numbers (around 64,000).
And although donations to extra large charities dropped by $4.7 billion when compared to the previous year, it should be noted that the previous year’s donation figures were boosted by a one-off, $4.9 billion donation to a single charity.
Table 43: Key financial information for extra large charities, with changes from previous year
| Total ($ million) | Change ($ million) from previous year | % change from previous year | Proportion of total sector | |
|---|---|---|---|---|
| Revenue | 136,262 | 11,833 | 9.5 | 57.1% |
| Income | 138,432 | 12,601 | 10.0 | 56.7% |
| Expenses | 133,506 | 13,328 | 11.1 | 57.9% |
| Net surplus/deficit | 4,926 | −726 | −12.8 | |
| Assets | 267,319 | 21,439 | 8.7 | 51.7% |
| Liabilities | 108,834 | 5,579 | 5.4 | 61.3% |
| Net assets/liabilities | 158,485 | 15,865 | 11.1 | |
| Asset ratio: 2.5 | ||||
Table 44: Revenue sources for extra large charities, with changes from previous year
Total | Proportion of total revenue | ||||
|---|---|---|---|---|---|
| Million ($) | Change ($ million) from previous year | % change from previous year | % | % change from previous year | |
| Government (including grants) | 72,922 | 8,435 | 13.1 | 53.5 | 1.7 |
| Donations and bequests | 3,038 | −4,689 | −60.7 | 2.2 | −4.0 |
| Goods or services | 47,453 | 7,400 | 18.5 | 34.8 | 2.6 |
| Investments | 5,337 | 1,929 | 56.6 | 3.9 | 1.2 |
| Other | 7,512 | −1,242 | −14.2 | 5.5 | −1.5 |
Table 45: Percentage of extra large charities receiving revenue from each revenue source, with changes from previous year
| % | % change from the previous year | |
|---|---|---|
| Government (including grants) | 92.2 | −2.7 |
| Donations and bequests | 76.8 | −1.8 |
| Goods or services | 90.8 | −0.3 |
| Investments | 93.8 | −1.0 |
| Other | 89.9 | 2.8 |
Table 46: Expense types for extra large charities, with changes from previous year
Total | Proportion of total expenses | ||||
|---|---|---|---|---|---|
| Million ($) | Change ($ million) from previous year | % change from previous year | % | % change from previous year | |
| Employee | 75,176 | 8,353 | 12.5 | 56.3 | 0.7 |
| Grants and donations within Australia* | 4,174 | −95 | −2.2 | 3.1 | −0.4 |
| Grants and donations outside Australia* | 666 | −69 | −9.4 | 0.5 | −0.1 |
| Interest | 1,965 | 317 | 19.2 | 1.5 | 0.1 |
| Other | 51,524 | 4,822 | 10.3 | 38.6 | −0.3 |
Note: Only large, very large and extra large charities are required to report on interest expenses. Further information on charity reporting by size is available in the Data section.
*Some charities distribute grants and donations
Many charities also have obligations to other regulators as well as the ACNC.
Around 75% of charities structured as incorporated associations were extra small or small. The largest proportion of extra small incorporated associations were based in NSW.
The percentage of incorporated associations is obtained from those charities that voluntarily provided us with an incorporated association number in their Annual Information Statement.
The percentage of charities that fundraise is derived from those charities that voluntarily provided us with a fundraising licence number in their Annual Information Statement.
Not all charities that fundraise are required to have a fundraising licence – for example, some charities may be exempt from requiring a licence depending on where they undertake fundraising activities.
Most non-government schools, aged care providers, higher education providers and NDIS providers were large, very large or extra large.
Data for ancillary funds, aged care providers, higher education providers and NDIS providers is drawn from publicly available datasets. The percentage of charities that are aged care providers is based on a charity’s legal name as registered with the Department of Health.
Table 47: Proportion of charities with reporting obligations to other regulators by charity size
| Type of charity | Extra small (%) | Small (%) | Medium (%) | Large (%) | Very large (%) | Extra large (%) | Total (%) |
|---|---|---|---|---|---|---|---|
| Incorporated associations | 35.4 | 39.6 | 18.3 | 4.3 | 2.3 | 0.1 | 100 |
| Charities that fundraise | 21.5 | 33.0 | 26.6 | 9.8 | 8.1 | 1.0 | 100 |
| Non-government schools | 0.6 | 0.2 | 14.4 | 32.9 | 48.6 | 3.2 | 100 |
| All ancillary funds | 29.0 | 44.5 | 20.6 | 4.1 | 1.7 | 0.1 | 100 |
| Aged care providers | 2.0 | 0.5 | 5.6 | 26.4 | 56.3 | 9.1 | 100 |
| Higher education providers | 1.3 | 3.8 | 13.8 | 7.5 | 27.5 | 46.3 | 100 |
| NDIS providers | 5.3 | 2.9 | 28.5 | 18.6 | 4.7 | 40.0 | 100 |
Table 48: Breakdown of incorporated associations by charity size
| State or territory | Extra small (%) | Small (%) | Medium (%) | Large (%) | Very large (%) | Extra large (%) | Total (%) |
|---|---|---|---|---|---|---|---|
| ACT | 30.3 | 43.4 | 19.7 | 5.1 | 1.5 | − | 100 |
| NSW | 37.6 | 38.9 | 21.1 | 2.2 | 0.2 | − | 100 |
| NT | 27.7 | 32.5 | 28.5 | 8.8 | 2.4 | − | 100 |
| QLD | 34.7 | 39.9 | 19.3 | 4.5 | 1.7 | − | 100 |
| SA | 34.2 | 38.2 | 15.8 | 5.8 | 5.8 | 0.4 | 100 |
| TAS | 34.0 | 33.7 | 19.7 | 7.8 | 4.8 | 0.2 | 100 |
| VIC | 36.4 | 40.5 | 16.0 | 4.9 | 2.2 | <0.1 | 100 |
| WA | 32.6 | 41.2 | 16.4 | 5.1 | 4.4 | 0.2 | 100 |
| Total | 35.4 | 39.6 | 18.3 | 4.3 | 2.3 | 0.1 | 100 |
Section 3: Data
Citation
Australian Charities and Not-for-profits Commission (2026). Australian Charities Report 12th Edition.
The Annual Information Statement
Our analysis is primarily based on information we collected from 53,641 Annual Information Statements for the 2024 reporting period (a charity’s financial year). Where our analysis has used other sources (such as ABS datasets) we have referenced the source.
The two most common reporting periods for the 2024 Annual Information Statement were:
- 1 July 2023 to 30 June 2024
- 1 January 2024 to 31 December 2024.
In some situations, such as when one charity controls one or more other charities, we allow a group of registered charities (known as a Reporting Group or group) to submit a single Annual Information Statement. These are referred to as Group Annual Information Statements.
In this report, the term ‘charities’ includes reporting groups and individual charities.
2024 Annual Information Statement submissions include:
- 53,320 statements submitted by individual charities
- 321 Group Annual Information Statements submitted on behalf of 1,209 registered charities.
Basic Religious Charities
A Basic Religious Charity is a type of religious charity that meets specific requirements. BRCs are not required to:
- answer the financial questions in the Annual Information Statement
- submit annual financial reports, or
- comply with ACNC Governance Standards.
More than 8,000 charities (8,200) reported as a BRC. Of those, 89.5% reported being small, 8.5% reported being medium and 2% reported being large. Some BRCs (585) voluntarily provided financial information. In the ‘breakdown by size’ section, these 585 have been categorised to a charity size based on their revenue.
Activity classifications
All charities that submitted an Annual Information Statement (and were operating) had the option to provide information on up to 10 activities using a classification system called CLASSIE (Classification system of Australian Social Sector Initiatives and Entities).
CLASSIE was specifically developed by Our Community for the social sector.
For each activity, charities can select from 864 different classifications. The ACNC removed some non-charitable classifications so that our use of CLASSIE was more suitable for the work of charities.
CLASSIE uses four levels – with Level 1 being the broadest or highest level (for example: arts and culture), and Level 4 being the most specific (for example: musical theatre).
In the Australian Charities Report, we use the CLASSIE Level 1 activity classifications.
Charity reporting based on size
Charities report different financial information to the ACNC based on size.
Table 49: Revenue reporting requirements based on charity size
| Is the charity required to report on the following revenue source? | Extra small and small charities | Medium, large, very large and extra large charities |
|---|---|---|
| Revenue from government (including grants) | Yes | Yes |
| Revenue from donations and bequests | Yes | Yes |
| Revenue from goods or services | Optional | Yes |
| Revenue from investments | Optional | Yes |
| Other revenue | Yes | Yes |
Table 50: Expense reporting requirements based on charity size
| Is the charity required to report on the following expense? | Extra small, small and medium charities | Large, very large and extra large charities |
|---|---|---|
| Employee | Yes | Yes |
| Grants and donations within Australia | Yes | Yes |
| Grants and donations outside Australia | Yes | Yes |
| Interest | No | Yes |
| Other (for example, rental expenses, bank charges, utilities, costs relating to service delivery) | Yes | Yes |
Methodology
Where possible, this report includes financial information:
- reported by Basic Religious Charities
- from charities that did not conduct activities, such as charities that may have received revenue from investments despite conducting no activities.
No estimated or proxy data is used. There may be minor rounding errors.
A small number of charities have been excluded from some analyses to remove significant errors. Although we have a process for reviewing as much charity data as possible, there may be errors in the data supplied by charities and used for this report.
Where a charity’s information is withheld from the Charity Register and could be identified from content in this report – for example, from tables that name specific charities – it has been removed.
Accessing ACNC data
There are various ways the public can access ACNC data:
Interactive Charity Data Explorer
The Charity Data Explorer includes extra analysis not available in this report. For example, it allows you to filter 2024 Annual Information Statement data by charity subtype or location.
You can access the Charity Data Explorer at
acnc.gov.au/charitydata.
Data.gov.au
We have published various datasets, including the dataset for the 2024 Annual Information Statement, at data.gov.au.
Datasets are updated weekly and do not include data from charities that have information withheld from the Charity Register.
The analysis in this report will not match the information at data.gov.au because:
- our analysis includes all information submitted by charities, including those that have information withheld from the Charity Register
- additional 2024 Annual Information Statements may have been submitted after we completed our analysis.
If you would like any further information about this report, or ACNC data in general, please contact us at research@acnc.gov.au.
Previous editions
This is the 12th annual Australian Charities Report.
All previous editions can be found on our website at acnc.gov.au/charitiesreport and in the Charity Data Hub.
Section 4: Appendices
This section is based on publicly available information. State or territory location is based on physical address.
Table 51: Australia’s top 10 charities or reporting groups by revenue
| No | Charity or reporting group name | State or territory | Total revenue ($) |
|---|---|---|---|
| 1. | University of Melbourne_ACNC GROUP | VIC | 3,695,144,000 |
| 2. | Victorian Catholic Education Authority Limited | VIC | 3,627,486,345 |
| 3. | The University of Sydney | NSW | 3,581,277,081 |
| 4. | Monash University | VIC | 3,473,100,000 |
| 5. | University of NSW_ACNC Group | NSW | 3,406,424,000 |
| 6. | St Vincent's Health Australia Ltd | NSW | 3,381,997,208 |
| 7. | The University of Queensland_ACNC Group | QLD | 2,824,247,000 |
| 8. | Melbourne Archdiocese Catholic Schools Ltd_ACNC Group | VIC | 2,490,802,596 |
| 9. | Little Company of Mary Health Care Limited_ACNC Group | NSW | 2,114,096,000 |
| 10. | St John Of God Health Care Inc | WA | 2,096,372,000 |
Table 52: Australia’s top 10 charities or reporting groups by donations and bequests
| No | Charity or reporting group name | State or territory | Donations and bequests ($) |
|---|---|---|---|
| 1. | World Vision Australia | VIC | 224,749,000 |
| 2. | Latter-day Saint Charities Australia | NSW | 145,000,000 |
| 3. | The Smith Family | NSW | 144,651,000 |
| 4. | Tarrawarra Museum Of Art Limited | VIC | 141,887,276 |
| 5. | Salvation Army - Social Work_ACNC Group | VIC | 133,240,000 |
| 6. | Medecins Sans Frontieres Australia Limited | NSW | 122,108,051 |
| 7. | University of Melbourne_ACNC GROUP | VIC | 112,875,000 |
| 8. | L.D.S. Charitable Trust Fund | NSW | 104,240,718 |
| 9. | Compassion Australia | NSW | 96,154,837 |
| 10. | The Fred Hollows Foundation | NSW | 83,534,000 |
Table 53: Australia’s top 10 charities or reporting groups by employees
| No | Charity or reporting group name | State or territory | Employees |
|---|---|---|---|
| 1. | Melbourne Archdiocese Catholic Schools Ltd_ACNC Group | VIC | 19,930 |
| 2. | Little Company of Mary Health Care Limited_ACNC Group | NSW | 17,516 |
| 3. | St John Of God Health Care Inc | WA | 16,611 |
| 4. | UnitingCare QLD_ACNC Group | QLD | 16,461 |
| 5. | Goodstart Early Learning_ACNC Group | QLD | 15,581 |
| 6. | RSL Care RDNS_ACNC Group | VIC | 15,458 |
| 7. | The Corporation Of The Trustees Of The Roman Catholic Archdiocese Of Brisbane | QLD | 14,159 |
| 8. | University of Melbourne_ACNC GROUP | VIC | 13,798 |
| 9. | Sydney Catholic Schools Trust | NSW | 13,475 |
| 10. | CATHOLIC EDUCATION WESTERN AUSTRALIA LIMITED | WA | 12,783 |
Table 54: Australia’s top 10 charities or reporting groups by volunteers
| No | Charity or reporting group name | State or territory | Volunteers |
|---|---|---|---|
| 1. | Clean Up Australia Limited | NSW | 1,077,127 |
| 2. | Surf Life Saving New South Wales_ACNC Group | NSW | 79,137 |
| 3. | The Duke of Edinburgh's International Award - Australia | NSW | 60,000 |
| 4. | Surf Life Saving Australia Limited | NSW | 45,236 |
| 5. | Surf Life Saving Queensland | QLD | 36,138 |
| 6. | MATES in Construction (Aust) Limited | QLD | 30,141 |
| 7. | Life Saving Victoria Limited | VIC | 30,129 |
| 8. | PADI AWARE_ACNC GROUP | NSW | 28,000 |
| 9. | Surf Life Saving Western Australia Inc | WA | 24,000 |
| 10. | Tangaroa Blue Foundation Ltd | WA | 20,514 |
The analysis in this appendix includes information from charities that submitted the 2024 Annual Information Statement, and voluntarily provided the ACNC with a physical address.
A charity’s physical address is most commonly the charity’s physical base – for example, a head office – and may be distinct from where it conducts its activities.
Individuals may also volunteer at a different location from the charity’s main address. For example, Clean Up Australia Limited has a physical address in NSW but has volunteers across Australia.
Based on the remoteness structure data in Australian Statistical Geography Standard Geographic Correspondences (2021) Edition 3, around 89% of charities have an address in Australia’s major cities or inner regional areas. Less than 9% of charities have an address in outer regional areas such as Mount Gambier in South Australia.
Compared to the previous year, more charities had a physical address based in the major cities or inner regional areas (an increase from 88.7% to 89.6%), which led to a drop in the proportion of charities based in outer regional, remote and very remote areas.
Table 55: Geography of charities based on physical address (postcode) and the Australian Statistical Geography Standard Geographic Correspondences (2021) Edition 3
| Charity size | Major cities – % of charities | Inner regional – % of charities | Outer regional – % of charities | Remote – % of charities | Very remote – % of charities |
|---|---|---|---|---|---|
| Extra small | 20.1 | 5.8 | 2.8 | 0.4 | 0.2 |
| Small | 22.0 | 5.5 | 2.4 | 0.4 | 0.2 |
| Medium | 11.3 | 2.6 | 1.0 | 0.2 | 0.1 |
| Large | 4.0 | 0.9 | 0.5 | 0.1 | 0.1 |
| Very large | 3.6 | 0.8 | 0.3 | 0.1 | <0.1 |
| Extra large | 0.4 | <0.1 | <0.1 | <0.1 | 0.0 |
| Size unknown (BRC) | 9.5 | 2.9 | 1.5 | 0.2 | 0.1 |
| Total | 70.9 | 18.7 | 8.5 | 1.3 | 0.6 |
Table 56: Key metrics (average per charity) based on physical address (state or territory)
Average per charity | ||||
|---|---|---|---|---|
| Physical address based in | Revenue ($) | Donations and bequests ($) | Employees | Volunteers |
| ACT | 4,924,255 | 192,720 | 31 | 44 |
| NSW | 3,482,753 | 328,685 | 22 | 112* |
| NT | 5,435,876 | 120,746 | 31 | 30 |
| QLD | 3,796,921 | 179,666 | 27 | 62 |
| SA | 3,512,010 | 131,548 | 29 | 45 |
| TAS | 3,089,510 | 128,611 | 24 | 47 |
| VIC | 4,108,682 | 287,904 | 25 | 47 |
| WA | 4,673,012 | 204,581 | 33 | 49 |
*Average charity-reported volunteer count is affected by one charity, Clean Up Australia Limited, which has a physical address in NSW but has volunteers across Australia.
For more information (including median figures per charity), use our Charity Data Explorer and filter by ‘state’.